Tuesday, March 25, 2025

Moving to: ikestockwatch.com

visit:  ikestockwatch.com

Wednesday, March 19, 2025

SPY Climbs Higher, but Will the Fed Keep the Rally Alive?

The S&P 500 ETF (SPY) continues to push higher, closing at $567.13 after gaining 1.06% following the Federal Reserve's latest policy update. The Fed held interest rates steady but signaled that rate cuts could be coming later this year, easing investor concerns about prolonged tight monetary policy. This announcement sparked a broad rally across major indices, with the Nasdaq jumping 1.4% and the Dow gaining 383 points. While the market’s reaction was positive, lingering uncertainties around trade tensions, inflation, and global economic growth could still impact SPY’s trajectory in the coming weeks.

Despite the rally, investors should approach the market cautiously. While the Fed’s dovish tone is supportive, geopolitical tensions between the U.S. and Iran, ongoing trade disputes, and oil price volatility remain key risks. Additionally, earnings season is approaching, and any disappointing results—especially from major tech companies—could trigger pullbacks. Analysts remain divided, with some forecasting new all-time highs for SPY, while others warn that the market is pricing in too many rate cuts too soon. A strong resistance level around $570-$575 could determine whether SPY continues its climb or faces another pullback.

How Should Investors Approach the Market?

  1. Stay Selective – Focus on sectors with strong fundamentals, like technology, healthcare, and consumer staples, which tend to hold up well in uncertain environments.
  2. Watch Key Technical Levels – If SPY breaks above $575, it could signal a continued rally. But if it struggles below this level, a pullback toward $555-$560 is possible.
  3. Monitor Economic Data & Earnings – Watch for GDP growth, inflation reports, and corporate earnings to confirm whether the market’s optimism is justified.
  4. Hedge Against Volatility – Consider protective puts or sector rotation into defensive stocks in case of renewed market weakness.

With a cautious but opportunistic mindset, investors can navigate the next few weeks by balancing growth opportunities with risk management. The Fed’s policy stance is bullish for SPY, but the market will need confirmation from economic data and corporate earnings to sustain the rally. 

Saturday, March 15, 2025

SPY Rebounds, But Will the Momentum Hold?

Over the past week, SPY (S&P 500 ETF) has seen increased volatility, driven by a mix of trade tensions, inflation concerns, and Federal Reserve speculation. After briefly entering correction territory—down more than 10% from its February highs—SPY managed to stage a strong recovery, closing at $562.81 on March 15, 2025. This 2.07% daily gain suggests that investors are buying the dip, but questions remain about whether the market has truly found a bottom.

The biggest factor influencing sentiment right now is trade policy uncertainty. President Trump’s 200% tariff on European alcohol products has intensified global trade disputes, causing ripple effects in financial markets. Additionally, analysts are split—Oppenheimer maintains an S&P 500 target of 7,100, while Goldman Sachs has cut its forecast, citing slower growth and potential stagflation. With major tech stocks still under pressure, investors are watching closely to see if this rally has legs.

Another key catalyst is the upcoming Federal Reserve (FOMC) meeting on March 20. Traders are speculating whether the Fed will signal a rate cut by June, which could provide support for equities. However, if policymakers take a hawkish stance, emphasizing inflation control over economic growth, SPY could struggle to hold onto recent gains. The CPI report this week showed easing inflation, but the Fed’s response remains uncertain.

For now, market sentiment is cautiously bearish, with traders reacting to both macro risks and technical levels. If SPY can break and hold above $565, it may signal further upside, while a rejection near resistance could lead to another leg lower. The next few trading sessions will be critical in determining whether this rebound is the start of a new uptrend or simply a temporary relief rally before another downturn.

Friday, March 7, 2025

BX (Blackstone Inc) Stock Analysis: Overvalued or High-Growth Opportunity?


BX Stock Analysis: Overvalued or High-Growth Opportunity?

Overview

This stock is part of the S&P 500, with a market cap of $176.89B and strong earnings growth (97.42% YoY EPS increase). However, it has an extremely high P/E ratio (40.05) and elevated Price-to-Sales (P/S 14.20), suggesting it may be overvalued.

With strong margins, high insider ownership (40.73%), and a dividend yield of 3.38%, the key question is: Is this stock worth its premium valuation? Let's break it down.


Fundamental Analysis

Valuation Metrics

  • P/E Ratio: 40.05 (High, suggesting overvaluation)
  • Forward P/E: 20.89 (Still high, but lower than current P/E)
  • PEG Ratio: 1.92 (Moderate, meaning growth may justify valuation)
  • Price-to-Sales (P/S) Ratio: 14.20 (Expensive compared to revenue)
  • Price-to-Book (P/B) Ratio: 21.58 (Extremely high, meaning the stock trades at a significant premium to assets)

📌 Key Takeaway: This stock is richly valued, but growth expectations may support it.

Profitability & Growth

  • Gross Margin: 99.55% (Incredibly high, indicating strong pricing power)
  • Operating Margin: 55.61% (Industry-leading efficiency)
  • Net Profit Margin: 22.29% (Very strong profitability)
  • EPS Growth (Y/Y): 97.42% (Massive earnings expansion)
  • EPS Growth (Next Y): 22.54% (Still strong, but slower growth ahead)

📌 Key Takeaway: This is a highly profitable company with strong growth momentum, but can it sustain this pace?

Dividend & Payout Ratio

  • Dividend Yield: 3.38% (Attractive for income investors)
  • Payout Ratio: 95.26% (Very high, meaning most profits are paid as dividends)

📌 Key Takeaway: The dividend is generous, but payout levels are close to unsustainable.

Financial Strength

  • Debt/Equity Ratio: 1.50 (Moderate debt level, but manageable)
  • ROE (Return on Equity): 36.95% (Strong return for shareholders)
  • Short Interest: 1.30% (No significant short squeeze risk)

📌 Key Takeaway: The company is financially stable, but high valuation presents risks.


Technical Analysis

Trend & Momentum

  • SMA 20 (Short-Term): -8.98% (Short-term downtrend)
  • SMA 50 (Medium-Term): -14.16% (Still weak)
  • SMA 200 (Long-Term): -5.53% (Bearish, but improving)
  • RSI (14): 28.24 (Oversold, potential bounce soon)
  • Beta: 1.59 (Moderate volatility, moves faster than the market)

📌 Key Takeaway: The stock is deeply oversold, meaning a short-term bounce is likely.

Support & Resistance Levels

  • 52-Week High: $200.28 (-27.53% from current price)
  • 52-Week Low: $114.76 (+26.48% above low)
  • Support Level: $135.00 - $140.00 (Key accumulation zone)
  • Resistance Levels: $160.00, $183.53 (target price)

📌 Key Takeaway: The stock is near a key support level and may be primed for a rebound.


Trade Setup & Plan

📌 Entry Point

  • Buy Zone: $135.00 - $145.00 (Near support, accumulation area)
  • Confirmation: Look for higher volume at support levels.

🎯 Profit Targets

  • Target 1: $160.00 (+10%) (First resistance level)
  • Target 2: $183.53 (+26%) (Analyst target price)
  • Target 3: $200.00 (+38%) (52-week high target)

🛑 Stop-Loss Strategy

  • Conservative Stop: $130.00 (Break of support signals further downside)
  • Aggressive Stop: $125.00 (More risk-tolerant traders can use this level)

💡 Risk-Reward Ratio: ~3:1
(Moderate risk with strong upside potential.)

Conclusion:

Why Buy?

  • Strong profitability (22.29% Net Profit Margin)
  • High earnings growth (97.42% YoY EPS)
  • Stock is oversold (RSI 28.24), possible bounce incoming
  • Decent dividend (3.38%) for income investors

Risks to Consider

  • Expensive valuation (P/E 40.05, P/S 14.20)
  • Dividend payout ratio (95.26%) is unsustainable
  • Stock is still in a long-term downtrend


Wednesday, March 5, 2025

Why I’m Holding SoFi (SOFI) for the Long Term

SoFi Technologies (SOFI) remains a key holding in my portfolio because of its long-term growth potential and strong positioning in the fintech space. While the stock has faced some volatility, I believe its unique approach—operating as a full-service digital bank—gives it a competitive advantage. SoFi's ability to offer banking services, personal loans, and investment products under one platform sets it apart from traditional banks and other fintech companies. The company's recent $697.6 million securitization of personal loans also indicates strong demand and effective risk management. While profitability remains a concern, SoFi is consistently growing revenue, expanding its customer base, and reducing reliance on third-party banking partners, all of which should contribute to long-term profitability.

In addition to holding shares, I have also sold Put options on SOFI, which means I may be assigned additional shares at a lower price. This strategy reflects my confidence in the stock's future, as it allows me to accumulate shares at a discount while generating premium income in the process. While some analysts have issued bearish ratings, others have price targets as high as $20, showing a wide range of expectations. I believe that as SoFi continues to scale and improve its balance sheet, investor sentiment will shift positively, potentially driving the stock higher over time. The company's ability to retain deposits and lower borrowing costs as a chartered bank is a crucial advantage that will help it compete in a high-interest rate environment.

Of course, this is not financial advice—just my personal outlook on the stock. I understand that short-term volatility and market sentiment can impact SoFi's price action, but my focus is on the bigger picture. The fintech industry is still in its early stages, and SoFi is well-positioned to capture a significant share of this market. With continued growth in its banking and lending divisions, I see the potential for long-term appreciation, and I’m comfortable holding my shares while strategically using options to enhance my position.

Tuesday, March 4, 2025

NVDA Stock Drops 25% – What’s Next for Investors Holding Long-Term?

NVIDIA (NVDA) has experienced a sharp decline recently, dropping about 25.5% from its 52-week high as concerns over tariffs, regulatory risks, and AI competition weigh on the stock. This pullback has been particularly painful for long-term investors, including myself, as I hold LEAPS (Long-Term Equity Anticipation Securities) on NVDA. While my initial thesis on NVDA’s long-term AI dominance remains intact, the short-term volatility has tested my conviction. The stock’s drop, despite a stellar Q4 earnings report showing 78% YoY revenue growth, highlights how broader macroeconomic and geopolitical risks can overshadow even strong fundamentals.

The decline seems to be driven by multiple factors beyond just profit-taking. New tariffs and regulatory concerns, particularly surrounding U.S.-China relations and chip restrictions, have created additional uncertainty. Reports that Chinese firms may be circumventing U.S. export bans by acquiring NVIDIA’s Blackwell chips through intermediaries have further complicated the regulatory landscape. Additionally, the emergence of DeepSeek, a Chinese AI startup offering cost-effective AI models, has added competitive pressure, raising doubts about sustained demand for NVIDIA’s most advanced chips. While these risks are real, the AI sector remains in its early stages, and demand for high-performance computing is likely to continue growing, benefiting NVIDIA in the long run.

Despite the short-term pain, I’m maintaining my position in NVDA LEAPS, as the stock is now trading at 25x forward earnings, the lowest multiple in a year. This valuation presents a compelling buying opportunity for long-term investors who believe in NVIDIA’s dominant position in AI and data center growth. While further downside is possible, the long-term secular trends in AI, autonomous driving, and cloud computing remain strong. That said, it’s essential to manage risk and be prepared for volatility, as near-term market sentiment is still fragile. My focus now is on whether NVDA can regain momentum once the macroeconomic headwinds settle and institutional buyers step back in.

Saturday, March 1, 2025

ALLY (Ally Financial Inc) : Strong Growth Potential or a Short-Term Dip?


ALLY - Stock Analysis: Strong Growth Potential or a Short-Term Dip?

Overview

ALLY stock has a reasonable P/E ratio (14.28), a low forward P/E (6.66), and strong EPS growth projections (51.50% next year). However, it has also seen negative EPS growth in the past five years (-16.14%), and its debt-to-equity ratio is slightly high (1.38).

Is this a turnaround stock with high potential, or is it just a temporary bounce? Let’s break it down.


Fundamental Analysis

Valuation Metrics

  • P/E Ratio: 14.28 (Fairly valued, not too expensive)
  • Forward P/E: 6.66 (Very low, suggesting strong future earnings)
  • PEG Ratio: 0.34 (Indicates strong growth at a discount)
  • Price-to-Sales (P/S) Ratio: 0.70 (Undervalued compared to revenue)
  • Price-to-Book (P/B) Ratio: 0.98 (Trading near book value, a positive sign)

📌 Key Takeaway: This stock is undervalued based on future earnings and revenue growth.

Profitability & Growth

  • Operating Margin: 5.15% (Decent, but not industry-leading)
  • Net Profit Margin: 4.92% (Healthy profitability)
  • EPS Growth (Y/Y): 56.46% (Strong earnings improvement)
  • EPS Growth (Next Y): 51.50% (Massive growth expected)
  • Sales Growth (Y/Y): 3.41% (Moderate revenue growth, but not spectacular)

📌 Key Takeaway: Strong EPS growth is driving value, but revenue growth remains modest.

Dividend & Payout Ratio

  • Dividend Yield: 3.23% (Attractive for income investors)
  • Payout Ratio: 66.70% (Sustainable, but close to the limit for reinvesting profits)

📌 Key Takeaway: Decent dividend yield with a safe payout ratio.

Financial Strength

  • Current Ratio: 1.48 (Healthy liquidity)
  • Debt/Equity Ratio: 1.38 (Moderate leverage, but not excessive)
  • Short Interest: 2.86% (Not a major short squeeze candidate)

📌 Key Takeaway: The company is financially stable, but debt is slightly higher than ideal.


Technical Analysis

Trend & Momentum

  • SMA 20 (Short-Term): -2.05% (Slight weakness)
  • SMA 50 (Medium-Term): -0.23% (Flat, no clear trend)
  • SMA 200 (Long-Term): -2.98% (Mild downtrend)
  • RSI (14): 45.64 (Neutral, not oversold or overbought)
  • Beta: 1.38 (Moderate volatility, moves slightly more than the market)

📌 Key Takeaway: The stock is consolidating and may be preparing for a move.

Support & Resistance Levels

  • 52-Week High: $45.46 (-18.39% from current price)
  • 52-Week Low: $31.95 (+16.12% above the low)
  • Support Level: $35.50 - $36.00 (Key accumulation zone)
  • Resistance Levels: $40.00, $44.76 (target price)

📌 Key Takeaway: The stock is near a key support level and could bounce higher.


Trade Setup & Plan

📌 Entry Point

  • Buy Zone: $35.50 - $37.00 (Near support, accumulation area)
  • Confirmation: Look for higher volume at support levels.

🎯 Profit Targets

  • Target 1: $40.00 (+8%) (First resistance level)
  • Target 2: $44.76 (+20%) (Analyst target price)
  • Target 3: $45.50 (+23%) (52-week high target)

🛑 Stop-Loss Strategy

  • Conservative Stop: $34.50 (Break of support signals further downside)
  • Aggressive Stop: $33.00 (More risk-tolerant traders can use this level)

💡 Risk-Reward Ratio: ~3:1
(Moderate risk with strong upside potential.)


Final Verdict: Buy or Avoid?

To summarize, this stock has a 75% Buy recommendation and a 25% Avoid rating.

Why Buy?

  • Very undervalued based on forward earnings (Forward P/E: 6.66)
  • Strong EPS growth projections (51.50% next year)
  • Good dividend yield (3.23%) with sustainable payout ratio
  • Stock near support, potential bounce opportunity

Risks to Consider

  • Revenue growth is slow (3.41% YoY)
  • Stock has no strong bullish momentum yet
  • Moderate debt (D/E 1.38), but not alarming

Tuesday, February 18, 2025

Ford: Deep Value or Justified Weakness?


F (Ford Motor Co) Stock Analysis: Deep Value or Justified Weakness?

Overview

This stock is trading at extremely low valuation multiples with a P/E of 6.38 and a P/S of 0.20, making it a potential deep value play. However, recent performance is negative, and debt is high (D/E: 3.59). Is this a bargain buy or a trap? Let's analyze its fundamentals, technicals, and trade setup.


Fundamental Analysis

Valuation Metrics

  • P/E Ratio: 6.38 (Undervalued compared to market average)
  • Forward P/E: 5.64 (Stock remains cheap based on future earnings)
  • Price-to-Sales (P/S) Ratio: 0.20 (Extremely low, suggesting undervaluation)
  • Price-to-Book (P/B) Ratio: 0.82 (Trading below book value, a rare opportunity)

📌 Key Takeaway: The stock is deeply undervalued compared to its earnings, sales, and book value.

Profitability & Growth

  • Gross Margin: 8.33% (Weak, indicating pricing pressure)
  • Operating Margin: 2.75% (Thin margins for an S&P 500 company)
  • Net Profit Margin: 3.18% (Low but still positive)
  • EPS Growth (Y/Y): 35.92% (Strong earnings growth)
  • EPS Growth (Next 5Y): 162.64% (High growth expectations)

📌 Key Takeaway: Earnings growth is accelerating, but low margins indicate weak pricing power.

Financial Strength

  • Current Ratio: 1.16 (Just above 1.0, meaning it can meet short-term obligations)
  • Debt/Equity Ratio: 3.59 (High leverage, raising financial risk)
  • Short Interest: 3.03% (Low short squeeze potential, not overly shorted)

📌 Key Takeaway: Debt is a major risk, but the company is still financially stable.


Technical Analysis

Trend & Momentum

  • SMA 20 (Short-Term): -5.23% (Bearish)
  • SMA 50 (Medium-Term): -6.49% (Bearish)
  • SMA 200 (Long-Term): -15.90% (Still in a strong downtrend)
  • RSI (14): 42.38 (Neutral, neither overbought nor oversold)
  • Beta: 1.60 (Moderate volatility, moves faster than market)

📌 Key Takeaway: The stock remains in a downtrend, and there are no clear reversal signals yet.

Support & Resistance Levels

  • 52-Week High: $14.85 (-37.17% decline)
  • 52-Week Low: $9.10 (+2.53% from current levels)
  • Support Level: $9.10 - $9.20 (Key accumulation zone)
  • Resistance Levels: $10.31, $12.00 (Short-term targets)

📌 Key Takeaway: The stock is near its 52-week low, meaning downside may be limited.


Trade Setup & Plan

📌 Entry Point

  • Buy Zone: $9.10 - $9.30 (Accumulation area)
  • Confirmation: Look for increased volume near support.

🎯 Profit Targets

  • Target 1: $10.31 (+10%) (First resistance level)
  • Target 2: $12.00 (+28%) (Medium-term resistance)
  • Target 3: $14.00 (+50%) (If sentiment improves)

🛑 Stop-Loss Strategy

  • Conservative Stop: $8.90 (Break of support signals further downside)
  • Aggressive Stop: $8.50 (Last resort stop-loss for higher risk tolerance)

💡 Risk-Reward Ratio: ~3:1
(Good potential return with manageable risk.)


Final Verdict: Buy or Avoid?

Why Buy?

  • Extremely undervalued (P/E 6.38, P/S 0.20)
  • Strong earnings growth (EPS +35.92% YoY)
  • Near key support levels (Limited downside)

Risks to Consider

  • Weak margins (Gross Margin 8.33%)
  • High debt (D/E 3.59) (Financial risk)
  • Stock is still in a downtrend

Friday, February 14, 2025

CMCSA (Comcast Corp) - Stock Analysis: Undervalued Opportunity or Value Trap?


CMCSA - Stock Analysis: Undervalued Opportunity or Value Trap?

Overview

This stock presents an intriguing opportunity with strong fundamentals, an undervalued price-to-earnings (P/E) ratio, and solid profitability. However, it is also in a technical downtrend, which raises the question—is it a bargain or a value trap? Let’s dive into the fundamentals, technicals, and an actionable trade plan.


Fundamental Analysis

Valuation Metrics

  • P/E Ratio: 8.53 (Significantly below market average, signaling undervaluation)
  • Forward P/E: 7.37 (Projected earnings improvement)
  • PEG Ratio: 1.26 (Fairly valued based on growth expectations)
  • Price-to-Book (P/B) Ratio: 1.57 (Not overpriced relative to assets)

📌 Key Takeaway: The stock is attractively priced relative to earnings and revenue, suggesting a potential bargain.

Profitability & Growth

  • Gross Margin: 58.11% (Healthy, indicating strong pricing power)
  • Operating Margin: 18.83% (Efficient operations)
  • Net Profit Margin: 13.09% (Consistent profitability)
  • EPS Growth (Y/Y): 11.62% 📈 (Solid earnings momentum)
  • EPS Growth (Next 5Y): 6.77% (Moderate but stable)

📌 Key Takeaway: This company has strong earnings and operational efficiency, making it a sustainable long-term investment.

Financial Strength

  • Current Ratio: 0.68 (Lower liquidity, potential short-term risk)
  • Debt/Equity Ratio: 1.23 (Moderate leverage, manageable for its size)
  • P/Free Cash Flow: 8.63 (Undervalued compared to cash flow generation)

📌 Key Takeaway: While the company generates good cash flow, its liquidity ratio suggests it could face short-term financial pressures.


Technical Analysis

Trend & Momentum

  • SMA 20 (Short-Term): -0.56% (Minor weakness)
  • SMA 50 (Medium-Term): -5.70% (Bearish trend)
  • SMA 200 (Long-Term): -10.32% (Still in a downtrend)
  • RSI (14): 45.93 (Neutral, not overbought or oversold)
  • Beta: 1.02 (Moves in line with the market)

📌 Key Takeaway: The stock is in a long-term downtrend but could be forming a bottom.


Trade Setup & Plan

📌 Entry Point

  • Buy Zone: $34.50 - $35.50 (Accumulation area)

🎯 Profit Targets

  • Target 1: $38.75 (+10.7%)
  • Target 2: $42.00 (+20%)
  • Target 3: $45.00 (+28.5%)

🛑 Stop-Loss Strategy

  • Conservative Stop: $33.75 (Minimal downside risk)
  • Aggressive Stop: $32.00 (Break of key support level)

💡 Risk-Reward Ratio: ~3:1
(Good potential return for the risk taken!)


Final Verdict: Buy or Avoid?

Why Buy?

  • Undervalued based on earnings & cash flow
  • Strong profit margins and earnings growth
  • Institutional ownership is high (85.58%)
  • Short interest (53.91M shares) could trigger a short squeeze

Risks to Consider

  • Downtrend in stock price (-10.32% SMA 200)
  • Liquidity risk (low current ratio)
  • Market conditions could impact recovery

Thursday, February 6, 2025

Why I’m Buying MARA Stock: A Strategic Investment in Bitcoin Mining


Marathon Digital Holdings (NASDAQ: MARA) has been on my radar for a while, and I recently decided to pull the trigger and add it to my portfolio. While MARA is a high-risk, high-reward stock, I believe the current setup presents a strong buying opportunity. Here’s why I’m investing in MARA and what makes it an attractive play in the Bitcoin mining space.

1. Bitcoin Correlation and Market Trends

MARA is one of the largest Bitcoin mining companies in the world, making it a direct proxy for Bitcoin’s price movement. As Bitcoin continues to gain mainstream acceptance and institutional adoption increases, its price remains a key driver of MARA’s performance. The most recent Bitcoin halving event in 2024 has historically led to supply constraints, which could drive further price appreciation. Since MARA’s revenue is tied to Bitcoin production, I see it as a leveraged way to capitalize on Bitcoin’s long-term growth.

2. Expansion and Diversification Efforts

Marathon has aggressively expanded its mining operations, securing low-cost energy sources and boosting its hash rate capacity. Additionally, the company is diversifying its revenue streams by venturing into AI-driven data centers and high-performance computing. While some analysts view this as a potential distraction, I see it as a strategic move to ensure long-term stability beyond Bitcoin mining.

3. Improving Financial Metrics

Despite market volatility, MARA has shown resilience. The company’s revenue growth has been impressive, with a 34.5% year-over-year increase in the latest earnings report. While operational costs remain high, Marathon’s strong balance sheet and recent expansion efforts suggest the company is positioning itself for long-term profitability. With Bitcoin’s price expected to climb, MARA’s revenue and earnings potential could surge in tandem.

4. Institutional Interest and Favorable Market Sentiment

Large institutional investors have started accumulating MARA shares, signaling confidence in its growth potential. Additionally, as regulatory clarity around Bitcoin improves, companies like Marathon that operate within compliance frameworks will likely benefit. The recent surge in Bitcoin ETF approvals further cements Bitcoin’s legitimacy, indirectly benefiting MARA.

5. Technical Setup and Entry Point

From a technical standpoint, MARA is trading in a consolidation phase after a strong uptrend. With support levels holding steady and Bitcoin showing signs of renewed strength, I see this as an optimal time to enter before a potential breakout. Given its past performance, MARA has the potential to deliver outsized returns when Bitcoin’s price rallies.

Final Thoughts: High Risk, High Reward

I fully acknowledge that MARA is a volatile stock and not for the faint of heart. However, for those who believe in Bitcoin’s long-term trajectory and want a leveraged exposure, MARA presents a compelling investment opportunity. While I will monitor my position closely and manage risk accordingly, I am confident in MARA’s ability to capitalize on the next Bitcoin bull run.

Disclosure: I currently hold a position in MARA and plan to keep it long-term. This is not financial advice—always do your own research before making investment decisions.

Wednesday, February 5, 2025

AMD 30-Day Forecast & Trade Plan


AMD 30-Day Forecast & Trade Plan – February 2025

📊 Key Technical Levels & Market Overview

  • Current Price: $112.01 (-6.27%)
  • Resistance Levels: $119 (20-day EMA), $140 (200-day EMA), $125 (previous support turned resistance)
  • Support Levels: $105 (recent low), $100 (psychological level), $95 (major support zone)
  • Indicators:
    • RSI: 38.92 (Near oversold)
    • MACD: Strongly bearish, momentum accelerating downward
    • IV Rank: 11% (Low implied volatility)

📌 Market Context:
AMD is in a strong downtrend, trading below both the 20-day and 200-day EMA, signaling continued weakness. The MACD is deep in negative territory, and RSI is approaching oversold—suggesting further downside but also a potential bounce if it reaches key support levels near $105-$100.


🔥 Bearish Put Debit Spread (Higher Probability Trade)

📉 If AMD stays below $115-$119 resistance, further downside toward $100-$105 is likely.

  • Entry: Short below $112
  • Target 1: $105
  • Target 2: $100
  • Stop-Loss: Above $120

📌 Options Play:

  • Buy AMD $110 Put
  • Sell AMD $105 Put

👉 ATM Put Debit Spread aligns with your strategy while keeping risk defined.


⚠️ Bullish Rebound Setup (Lower Probability)

📈 If AMD holds $105 and reclaims $120, it could attempt a reversal toward $130+.

  • Entry: Long above $120
  • Target: $125-$130
  • Stop-Loss: Below $110

📌 Options Play:

  • Buy AMD $120 Call
  • Sell AMD $125 Call

👉 Low IV means calls are cheaper, but spreads reduce risk.


🔎 Market Sentiment & Analysis

🔹 IV Rank 11% – Very low volatility, meaning options are cheap, favoring debit spreads over credit spreads.
🔹 MACD Deep in Negative Territory – Suggests strong bearish momentum.
🔹 RSI Nearing 30 – If AMD hits $105, watch for oversold conditions and a possible bounce.


🚀 Final Takeaways

Bearish bias as long as AMD remains below $119
Put debit spreads offer a high-probability trade toward $105-$100
Watch for a temporary bounce near $105 if RSI becomes oversold


UBER 30-Day Forecast & Trade Plan


UBER 30-Day Forecast & Trade Plan – February 2025

📊 Key Technical Levels & Market Overview

  • Current Price: $64.25 (-7.89%)
  • Resistance Levels: $68.14 (200-day EMA), $70 (psychological level)
  • Support Levels: $60 (short-term), $55 (major support)
  • Indicators:
    • RSI: 42.62 (Approaching oversold)
    • MACD: Bearish, momentum weakening
    • IV Rank: 24% (Low implied volatility)

📌 Market Context:
Uber (UBER) sold off heavily (-7.89%) post-earnings, dropping below the 200-day EMA ($68.14). The bearish MACD crossover and RSI trending lower suggest further downside potential unless it can reclaim the $68-$70 resistance zone.


🔥 Bearish Put Debit Spread (Breakdown Trade)

📉 If UBER fails to reclaim $65-$66, a move toward $60 or lower is likely.

  • Entry: Short below $64
  • Target 1: $60
  • Target 2: $55
  • Stop-Loss: Above $68

📌 Options Play:

  • Buy UBER $64 Put
  • Sell UBER $60 Put

👉 ATM Put Debit Spread aligns with your strategy while keeping risk defined.


⚠️ Bullish Rebound Setup (Lower Probability)

📈 If UBER reclaims $68-$70, it could attempt a move back toward $75+.

  • Entry: Long above $68
  • Target: $72-$75
  • Stop-Loss: Below $64

📌 Options Play:

  • Buy UBER $68 Call
  • Sell UBER $72 Call

👉 Low IV makes outright calls cheaper, but spreads still reduce risk.


🔎 Market Sentiment & Analysis

🔹 IV Rank 24% – Low volatility means options are cheap, favoring debit spreads over credit spreads.
🔹 MACD Bearish Crossover – Indicates further downside risk.
🔹 RSI at 42 – Nearing oversold, but not there yet, meaning further selling pressure is possible.


🚀 Final Takeaways

Bearish bias as long as UBER remains below $68
Put debit spreads offer a high-probability trade toward $60-$55
Watch for a failed bounce attempt at $65-$66 before entering shorts

Saturday, February 1, 2025

AMZN 30-Day Forecast & Trade Plan


AMZN 30-Day Forecast & Trade Plan – February 2025

📊 Key Technical Levels & Market Overview

  • Current Price: $237.68 (+1.30%)
  • Resistance Levels: $241.77 (recent high), $250 (psychological resistance)
  • Support Levels: $230 (short-term), $220 (stronger support), $196.38 (200-day EMA)
  • Indicators:
    • RSI: 64.26 (Approaching overbought)
    • MACD: Bullish, with strong momentum
    • IV Rank: 69% (Elevated implied volatility)

📌 Market Context:
Amazon (AMZN) is trading near highs, maintaining strong bullish momentum. RSI is nearing overbought levels, and MACD is still rising, signaling continued upside potential. However, IV is elevated, meaning options are more expensive, favoring spreads over outright calls.


🔥 Bullish Call Debit Spread (Momentum Trade)

📈 If AMZN breaks and holds above $241.77, it could push toward $250+.

  • Entry: Long above $238
  • Target 1: $245
  • Target 2: $250
  • Stop-Loss: Below $230

📌 Options Play:

  • Buy AMZN $240 Call
  • Sell AMZN $245 Call

👉 ATM Call Debit Spread reduces exposure to high IV while capturing upside.


⚠️ Bearish Reversal Setup

📉 If AMZN rejects $241.77 and drops below $230, it could fall to $220 or lower.

  • Entry: Short below $230
  • Target: $220, then $215
  • Stop-Loss: Above $238

📌 Options Play:

  • Buy AMZN $230 Put
  • Sell AMZN $225 Put

👉 Credit spreads could work here as well since IV is elevated.


🔎 Market Sentiment & Analysis

🔹 IV Rank 69%High volatility favors debit spreads over single options.
🔹 MACD bullish – Indicates continued momentum.
🔹 RSI approaching 70 – Could trigger a temporary pullback if overbought.


🚀 Final Takeaways

Bullish bias as long as AMZN holds above $230
Call debit spreads offer strong risk/reward given high IV
Watch for rejection at $241.77 or breakdown below $230

Friday, January 31, 2025

TSLA 30-Day Forecast & Trade Plan


TSLA 30-Day Forecast & Trade Plan – February 2025

📊 Key Technical Levels & Market Overview

  • Current Price: $400.28
  • Resistance Levels: $406-$415 (short-term), $488.54 (major resistance)
  • Support Levels: $390-$385 (short-term), $293.51 (200-day EMA, strong long-term support)
  • Indicators:
    • RSI: 48.71 (Neutral)
    • MACD: Weak bullish signal, but momentum fading
    • IV Rank: 46% (Moderate implied volatility)
    • Volume: Below recent highs, indicating indecision

📌 Market Context:
TSLA is consolidating below the 20-day EMA ($406.11) after a major run-up. Momentum is fading, and traders should watch for a decisive move either above $406 resistance or below $390 support before taking aggressive positions.


🔥 Bullish Breakout Setup

📈 A breakout above $406-$415 could trigger a push toward $440-$450, continuing its strong bullish trend from Q4 2024.

  • Entry: Long above $406
  • Target 1: $440
  • Target 2: $450
  • Stop-Loss: $390

📌 Options Play:

  • Buy TSLA $410 Call (30-45 DTE)
  • Sell TSLA $450 Call (Debit Spread)

👉 Moderate IV makes call spreads a controlled-risk way to play upside while managing cost.


⚠️ Bearish Breakdown Setup

📉 Failure to hold $390 support could send TSLA toward the $360-$350 range.

  • Entry: Short below $390
  • Target: $370, then $350
  • Stop-Loss: $405

📌 Options Play:

  • Buy TSLA $380 Put
  • Sell TSLA $350 Put (Credit Spread to hedge risk)

👉 With IV at moderate levels, buying puts offers directional exposure, but spreads hedge against time decay.


🔎 Market Sentiment & Analysis

🔹 IV Rank (46%)Moderate implied volatility suggests options are not overly expensive, favoring directional plays.
🔹 MACD weakening – Indicates momentum slowdown, making TSLA vulnerable to a breakdown.
🔹 RSI at 48 – Suggests neutral sentiment, meaning TSLA could stay range-bound before a larger move.


📌 Trading Psychology: Don’t Chase Premature Moves

📌 Wait for confirmation above $406 or below $390 before committing to a trade. TSLA tends to fake out traders with false breakouts, so volume confirmation is key.


🚀 Final Takeaways

Breakout above $406 = Bullish toward $440+
Breakdown below $390 = Bearish toward $370-$350
Low-volume range = Patience required for confirmation


Wednesday, January 29, 2025

IWM 30-Day Forecast & Trade Plan


IWM 30-Day Forecast & Trade Plan 

📊 Key Technical Levels & Market Overview

  • Current Price: $226.23 (-0.23%)
  • Resistance Levels: $230-$235 (short-term), $244.98 (major resistance)
  • Support Levels: $225 (20-day EMA), $217 (200-day EMA)
  • Indicators: RSI 50.33 (Neutral), MACD weak bullish crossover, IV Rank 15% (low volatility)

📌 Market Context:
IWM remains range-bound, consolidating between $225 and $230 with no clear breakout. Momentum is neutral, and traders should focus on range-bound strategies until a breakout occurs.


🔥 Bullish Breakout Setup

📈 A breakout above $230 could push IWM toward $235-$240, continuing its longer-term trend.

  • Entry: Long above $230
  • Target 1: $235
  • Target 2: $240
  • Stop-Loss: $225

📌 Options Play:

  • Buy IWM $230 Call (30-45 DTE)
  • Sell IWM $240 Call (Debit Spread)

👉 Low IV makes call spreads an attractive way to play upside while limiting cost.


⚠️ Bearish Breakdown Setup

📉 A breakdown below $225 could lead IWM toward its 200-day EMA at $217, an important level for long-term trend continuation.

  • Entry: Short below $224
  • Target: $220, then $217
  • Stop-Loss: $228

📌 Options Play:

  • Buy IWM $220 Put
  • Sell IWM $210 Put (Credit Spread for IV Edge)

👉 With IV Rank low, long puts are preferable, but credit spreads offer a defined risk approach.


🔎 Market Sentiment & Analysis

🔹 Low IV (IV Rank: 15%) – Indicates options are cheap, favoring long directional plays over premium-selling strategies.
🔹 MACD Crossover – Slightly bullish but not aggressive. Momentum needs confirmation.
🔹 RSI at 50 – Neutral, meaning the market is in a decision zone between buyers and sellers.


📌 Trading Psychology: Be Patient on Confirmation

Many traders jump into breakouts too early—watch $230 for a strong move with volume before committing to longs. Likewise, a breakdown below $224 should be confirmed by price action before going short.


🚀 Final Takeaways

Watch for a break above $230 for a long setup
Low IV favors debit spreads over credit spreads
Support at $217 is critical for trend continuation

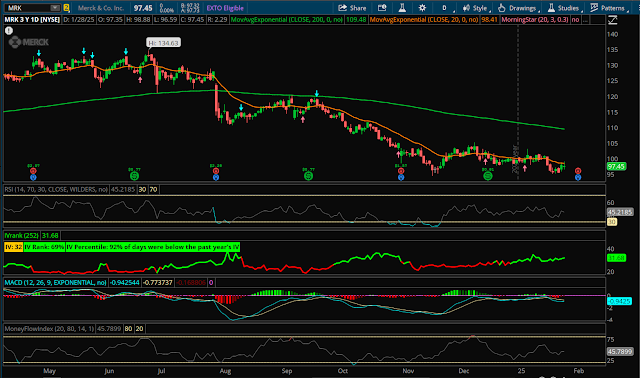
MRK (Merck & Co., Inc.) Stock Analysis


MRK (Merck & Co., Inc.) Stock Analysis - January 2025

Technical Overview:

  • Current Price: $97.45 (-0.50%)

  • Key Levels:

    • Support: $94.48 (52-week low), psychological support at $95
    • Resistance: $98.50 (near-term), $109.48 (200-day EMA)
    • 52-Week Range: $94.48 - $134.63
  • Moving Averages:

    • 20-day EMA: $98.41 (immediate resistance)
    • 200-day EMA: $109.48 (long-term bearish trend)
  • Indicators:

    • RSI (14): 45.22 (neutral, slightly bearish)
    • MACD: Negative, signaling weak momentum
    • IV Rank: 69% (high implied volatility, good for option selling strategies)
    • MFI (Money Flow Index): 45.78 (neutral, no strong buying pressure)

Fundamental Overview:

  • Market Cap: $246.51B
  • Income: $12.15B
  • Sales: $62.89B (P/S ratio of 3.92, fairly valued)
  • Book Value per Share: $17.58 (trading significantly above book value)
  • Cash per Share: $5.79
  • Debt/Equity: 0.86 (moderate leverage)
  • Quick Ratio: 1.15, Current Ratio: 1.36 (adequate liquidity)

Profitability Metrics:

  • ROA: 10.83%
  • ROE: 28.33%
  • Profit Margin: 19.32%
  • Gross Margin: 73.03%

Growth Metrics:

  • Sales Growth (Y/Y): 8.17%
  • EPS Growth (Y/Y): 163.70%
  • EPS Next Year: 9.19 (positive growth projection)

Insider & Institutional Holdings:

  • Insider Ownership: 0.10% (low, neutral)
  • Institutional Ownership: 78.75% (high institutional backing)
  • Short Interest: 1.35% (low, no major bearish bets)

Volatility:

  • Beta: 0.40 (low volatility, defensive stock)
  • ATR (14): 2.04 (moderate volatility)

Bias:

Neutral to slightly bearish

  • MRK is in a downtrend below the 200-day EMA, signaling weak momentum.
  • RSI and MACD suggest lack of strong buying interest, but support around $95 could hold.
  • High IV Rank makes option selling strategies attractive.

Trade Ideas:

1. Bear Call Spread (Bearish Play)

  • Sell the $100 Call
  • Buy the $105 Call
  • Expiration: 30-45 days
  • Rationale:
    • Profits if MRK stays below $100 resistance.
    • Takes advantage of high IV (expensive options).

2. Iron Condor (Range-Bound Play)

  • Sell the $95 Put / Buy the $90 Put
  • Sell the $100 Call / Buy the $105 Call
  • Expiration: 30-45 days
  • Rationale:
    • Profits if MRK stays between $95 and $100.
    • Takes advantage of high IV and time decay.

3. Cash-Secured Put (Bullish Play)

  • Sell the $95 Put
  • Expiration: 30-60 days
  • Rationale:
    • Generates income while potentially buying MRK at a discount if assigned.
    • Uses support at $94.50 as a defense level.

Conclusion:

  • Preferred Trade: Bear Call Spread – Higher probability given technical weakness and high IV.
  • Key Watch Levels: $95 support and $100 resistance.
  • Risk Management: Stop-loss if MRK closes above $100 for bearish trades.

Monday, January 27, 2025

Why I Believe NVIDIA (NVDA) is a Great Long-Term Investment

Why I Believe NVIDIA (NVDA) is a Great Long-Term Investment

As someone who holds a position in NVIDIA (NVDA), I’ve spent a lot of time evaluating its potential, and I’m convinced it’s a solid long-term play. Here’s why:

1. AI Leadership: NVIDIA is at the forefront of the AI revolution. Its GPUs are essential for training AI models, powering advancements in machine learning, autonomous systems, and generative AI. With AI poised to become a trillion-dollar industry, NVIDIA’s role is only growing.

2. Data Center Expansion: The demand for data centers is skyrocketing, and NVIDIA’s GPUs are the backbone of this infrastructure. This segment has been a massive growth driver, and I believe it will continue to fuel the company’s success.

3. Gaming Dominance: NVIDIA still reigns supreme in the gaming GPU market. With continued innovation, like their RTX line, they remain a favorite among gamers worldwide.

4. Diversification: Beyond gaming and AI, NVIDIA is expanding into autonomous vehicles, enterprise solutions, and even the metaverse. This diversified portfolio gives me confidence in its ability to thrive across various industries.

5. Strong Track Record: NVIDIA’s history of innovation, like the recent H100 GPUs designed for AI applications, shows me they’re not just keeping up—they’re setting the pace for the future.

As an investor, I’m excited to hold onto my NVDA shares. While no investment is without risk, I believe NVIDIA’s position in AI and tech innovation makes it a cornerstone for the future.


Disclosure: I currently have a position in NVDA and plan to hold it long-term. This article is for informational purposes only and should not be considered financial advice. Investing involves risks, and you should do your own research or consult with a financial advisor before making investment decisions.

Sunday, January 26, 2025

NVDA (Nvidia Corporation) Technical Analysis


NVDA (Nvidia Corporation)  Technical Analysis - January 2025


Technical Overview:

  • Current Price: $142.62 (-3.12%)

  • Key Levels:

    • Support: Around $136 (recent low), $108 (200-day EMA)
    • Resistance: $153.13 (recent high), psychological resistance at $160
    • 52-Week Range: $59.94 - $153.13
  • Moving Averages:

    • 20-day EMA: $108.79 (short-term bullish)
    • 200-day EMA: $71.80 (long-term uptrend intact)
  • Indicators:

    • RSI (14): 53.95 (neutral, no strong momentum)
    • MACD: Slightly bullish with a positive crossover, indicating upward momentum
    • IV Rank: 14% (low implied volatility, indicating options may be cheap)
    • MFI (Money Flow Index): 55.37 (neutral, indicating balanced buying and selling pressure)

Fundamental Overview:

  • Market Cap: $3,492.76B
  • Income: $63.07B
  • Sales: $113.27B (P/S ratio of 30.84, suggesting overvaluation concerns)
  • Book Value per Share: $2.69 (trading significantly above book value)
  • Cash per Share: $1.57
  • Debt/Equity: 0.16 (low leverage, financially stable)
  • Quick Ratio: 3.64, Current Ratio: 4.10 (strong liquidity position)

Profitability Metrics:

  • ROA: 84.01% (exceptional asset efficiency)
  • ROE: 127.21% (strong return on equity)
  • Profit Margin: 55.69% (high profitability)
  • Gross Margin: 75.86%

Growth Metrics:

  • Sales Growth (Y/Y): 152.44%
  • EPS Growth (Y/Y): 127.71%
  • EPS Growth (Next Y): 50.74%

Insider & Institutional Holdings:

  • Insider Ownership: 3.99% (low but stable)
  • Institutional Ownership: 65.29% (high institutional interest)
  • Short Interest: 1.22% (low short interest, indicating bullish sentiment)

Volatility:

  • Beta: 1.63 (higher market sensitivity)
  • ATR (14): 5.76 (moderate volatility)

Bias:

Bullish with potential pullbacks

  • NVIDIA is in a long-term uptrend, supported by strong fundamentals and institutional interest.
  • However, the RSI and MFI indicate a neutral stance, suggesting consolidation before a potential breakout.
  • Low implied volatility makes options attractive for long positions.

Higher Probability Trade:

1. Bull Call Spread (Bullish Play)

  • Buy the $145 Call
  • Sell the $155 Call
  • Expiration: 30-45 days
  • Rationale:
    • Profits if NVDA moves higher towards $150-$155.
    • Lower cost due to the low implied volatility.

2. Cash-Secured Put (Neutral to Bullish Play)

  • Sell the $140 Put
  • Expiration: 30-45 days
  • Rationale:
    • Generates income while potentially acquiring shares at a discount if assigned.
    • Takes advantage of low implied volatility.

3. Iron Condor (Neutral Play)

  • Sell the $135 Put / Buy the $130 Put
  • Sell the $150 Call / Buy the $155 Call
  • Expiration: 30-60 days
  • Rationale:
    • Profits if NVDA remains range-bound between $135-$150.
    • Takes advantage of time decay.

Conclusion:

  • Preferred Trade: Bull Call Spread – Higher probability given strong fundamentals and potential upside.
  • Key Watch Levels: $136 support and $153 resistance.
  • Risk Management: Stop-loss if price closes below $136 for bullish trades.

CNBC - Top News

Powered By Blogger